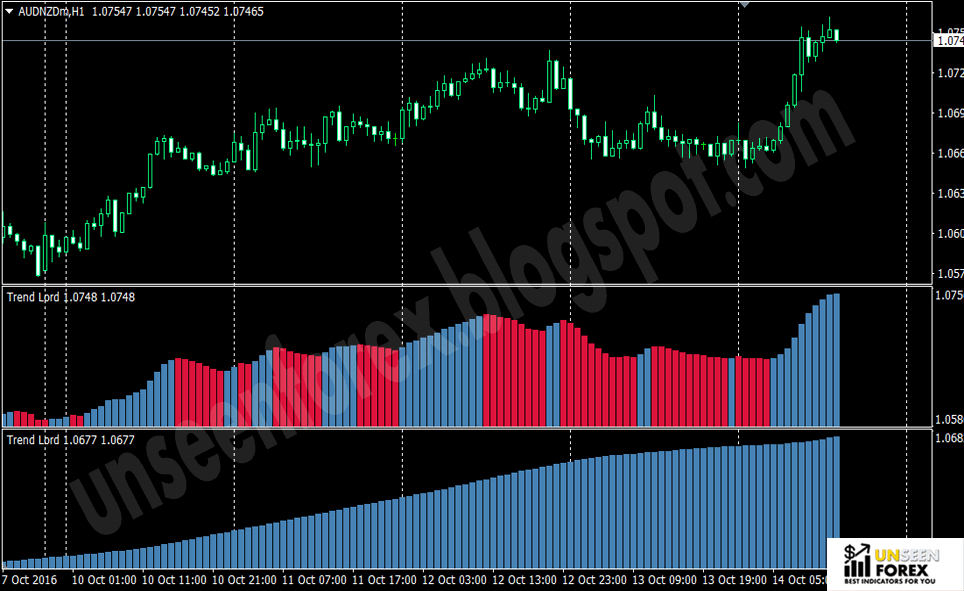
The trendlord indicator is being given away free by Hector (a version with inputs below). It looks a bit like an macd and playing around with it I came up with something interesting. I am currently using trendlines, s/r and ma's combined with mtf analysis to take trades on eurusd 1 hour charts and doing ok but this looks more interesting again and I am going to trial it for the next week and post the results.
The setup is very simple, a 1 hour chart of eurusd with a trendlord set at 5 and a trendlord set at 150 underneath. Only take trades in the direction of the 150 trendlord and you enter a buy/sell market order when the next hourly candle closes in that direction and changes colour. (Edit: I should clarify this... when the trendlord 5 changes colour)
I will use a 30 pip stop and move to break even after a move of 30 pips. The exit if not stopped out is when the trendlord 5 changes colour against the trade whether that's in profit or loss.
A chart is attached with some entries marked. You will notice that you can get chopped about a bit but you do catch some very nice moves which by my backtesting should more than make up for the losses.
The red lines are entries, the blue are exits. The green text is entry price, the red text is exit price. Of course in reality you may not take all of these trades because you may not be watching when a trade triggers an entry or exit but the theory looks sound so let's give it a go.


No comments:
Post a Comment